About Me

My name is Ilija Medan and I am a Postdoctoral Fellow at the Canadian Institute for Theoretical Astrophysics (University of Toronto) under the advisement of Dr. Juna Kollmeier.
Generally, I am interested in population studies of low-mass stars in the Solar Neighborhood using data from large astronomical surveys (Gaia, SDSS, 2MASS, Pan-STARRS, etc.).
My work focuses on using statstical methods to understand the frequency and distribution of low-mass field stars and binaries as a function of chemistry, kinemtics and
Galactic population. Much of my ongoing work makes use of results from SDSS-V.
Outside of my research work, I also have multiple roles within SDSS-V. I am the co-chair of the Solar Neighborhood Census working group, where I help organize working calls,
scientific projects and targeting for the survey. I also serve as the FPS Design Implementation Lead for SDSS-V. Through this position, I am the main contributor to the software package
mugatu,
which validates planned SDSS-V observations based on a number of science and observing requirements,
and then loads these planned observations into a targeting database so they can be accessed at the telescope. Finally, I have recently joined the SDSS-V
astra team. In this role, I am actively developing the software to
run the various data analysis pipelines, interface with the scientific working group leads to improve and validate astra outputs, and run the framework to create products for
internal use and public data releases.
Recent Work
Selection Function for Solar Neighborhood Census
The Solar Neighborhood Census (SNC) from SDSS-V provides an exquiste dataset to study the local population of stars, and how they vary with e.g., metallicity, age and Galactic population.
However, due to competing observing programs and fiber assignment constraints, the resulting sample carries severe and
complex selection effects. In this work, I developed a framework to characterize the selection function of the SDSS-V SNC relative
to the Gaia Catalog of Nearby Stars (GCNS), along with a forward modeling method to infer the properties of stellar
subpopulations across the GCNS-defined 100 pc sample. The selection function is based on a method that models the
selection probability as a function of sky position, Gaia G magnitude, and BP − RP . The resulting detection probabilities
faithfully reproduce the known survey planning logic. The method further introduces the concept of a “subpopulation probability"; a
grid of posterior estimates across the Hertzsprung-Russell (HR) diagram representing the likelihood that a GCNS member belongs
to a given SDSS-V defined subpopulation. With this method, we can charazterize volume complete subpopulations of stars jointly informed by
SDSS-V and Gaia data.
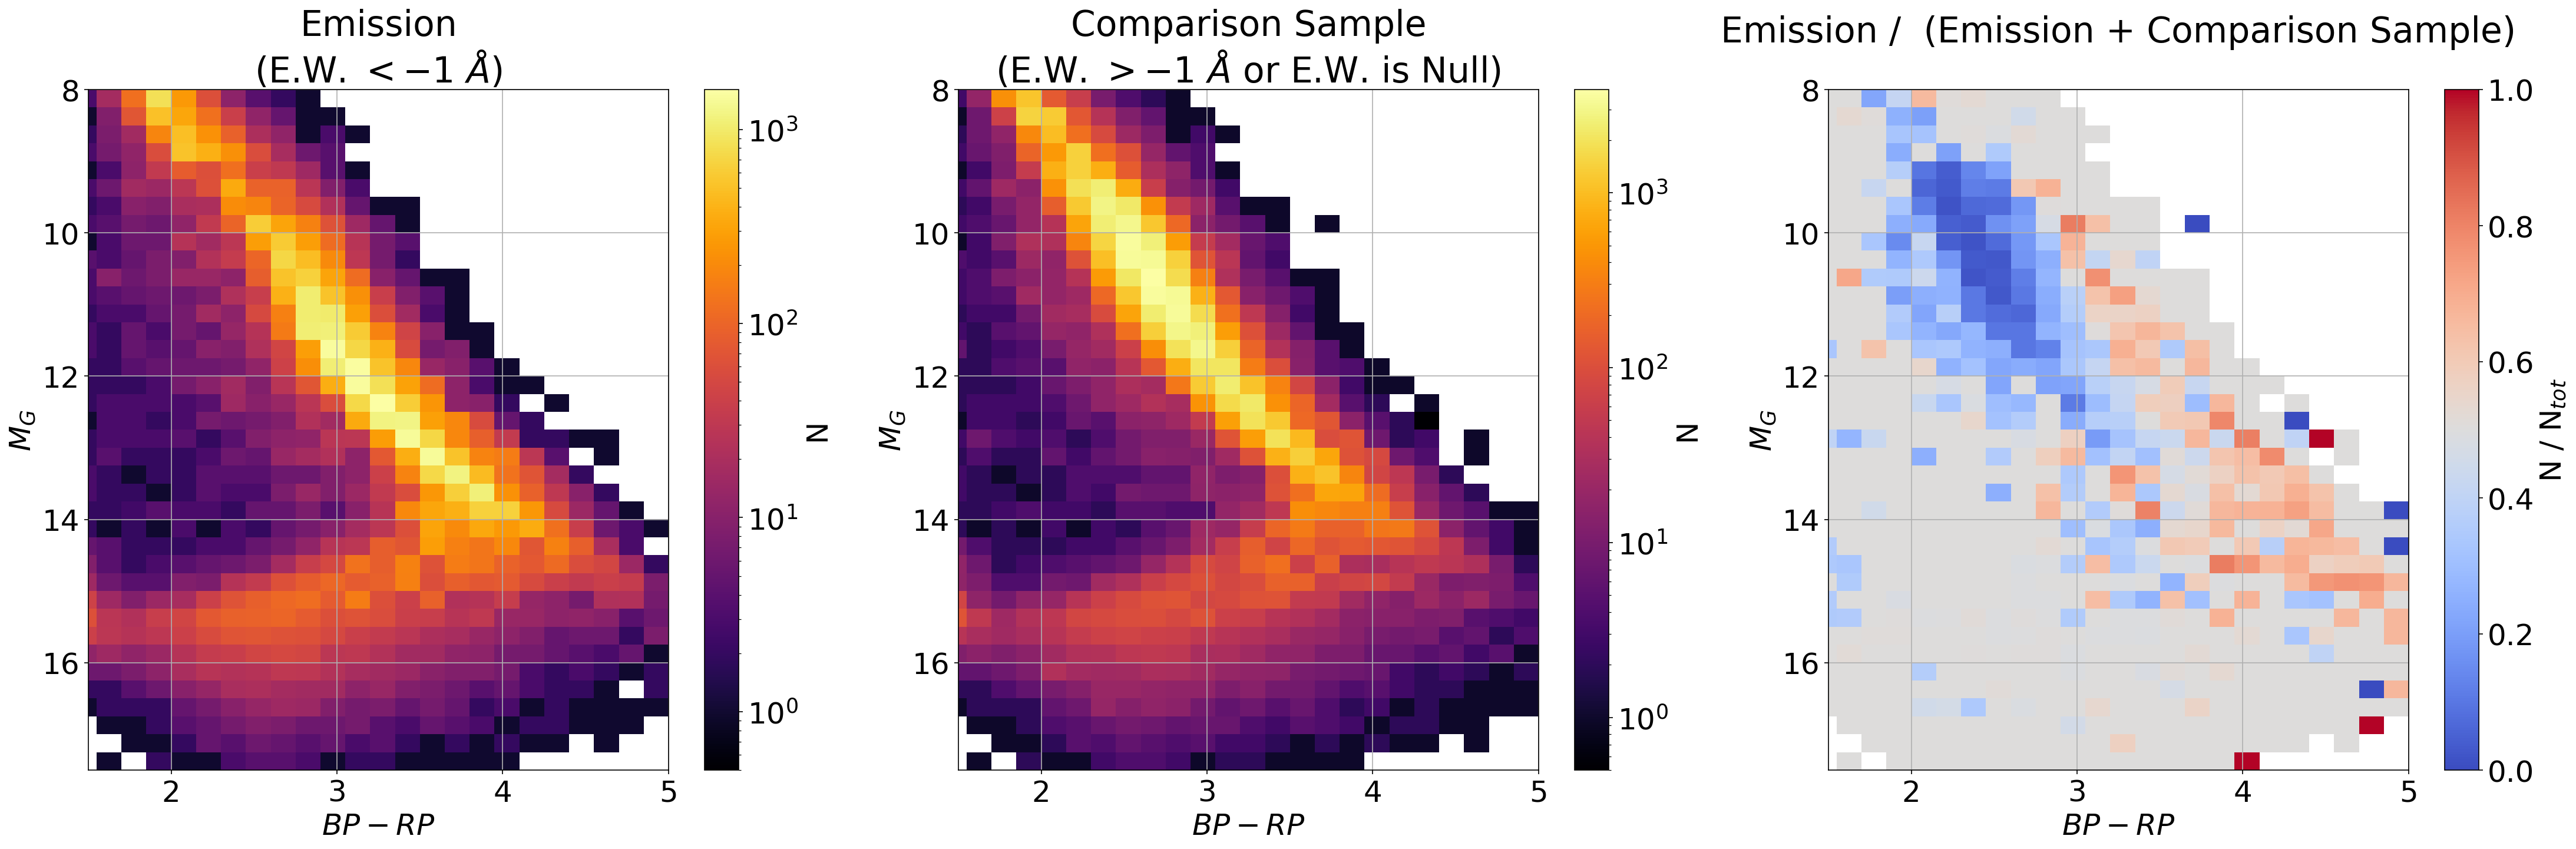
For example, we can use the optical BOSS spectra of SDSS-V to identify chromospherically active low-mass stars. With the above method, we can
determine which stars in the GCNS likely belong to this subpopulation and examine the fraction of active stars across the HR diagram, as shown below. Here
we see a clear increase in the detection of active stars as we go to lower masses.
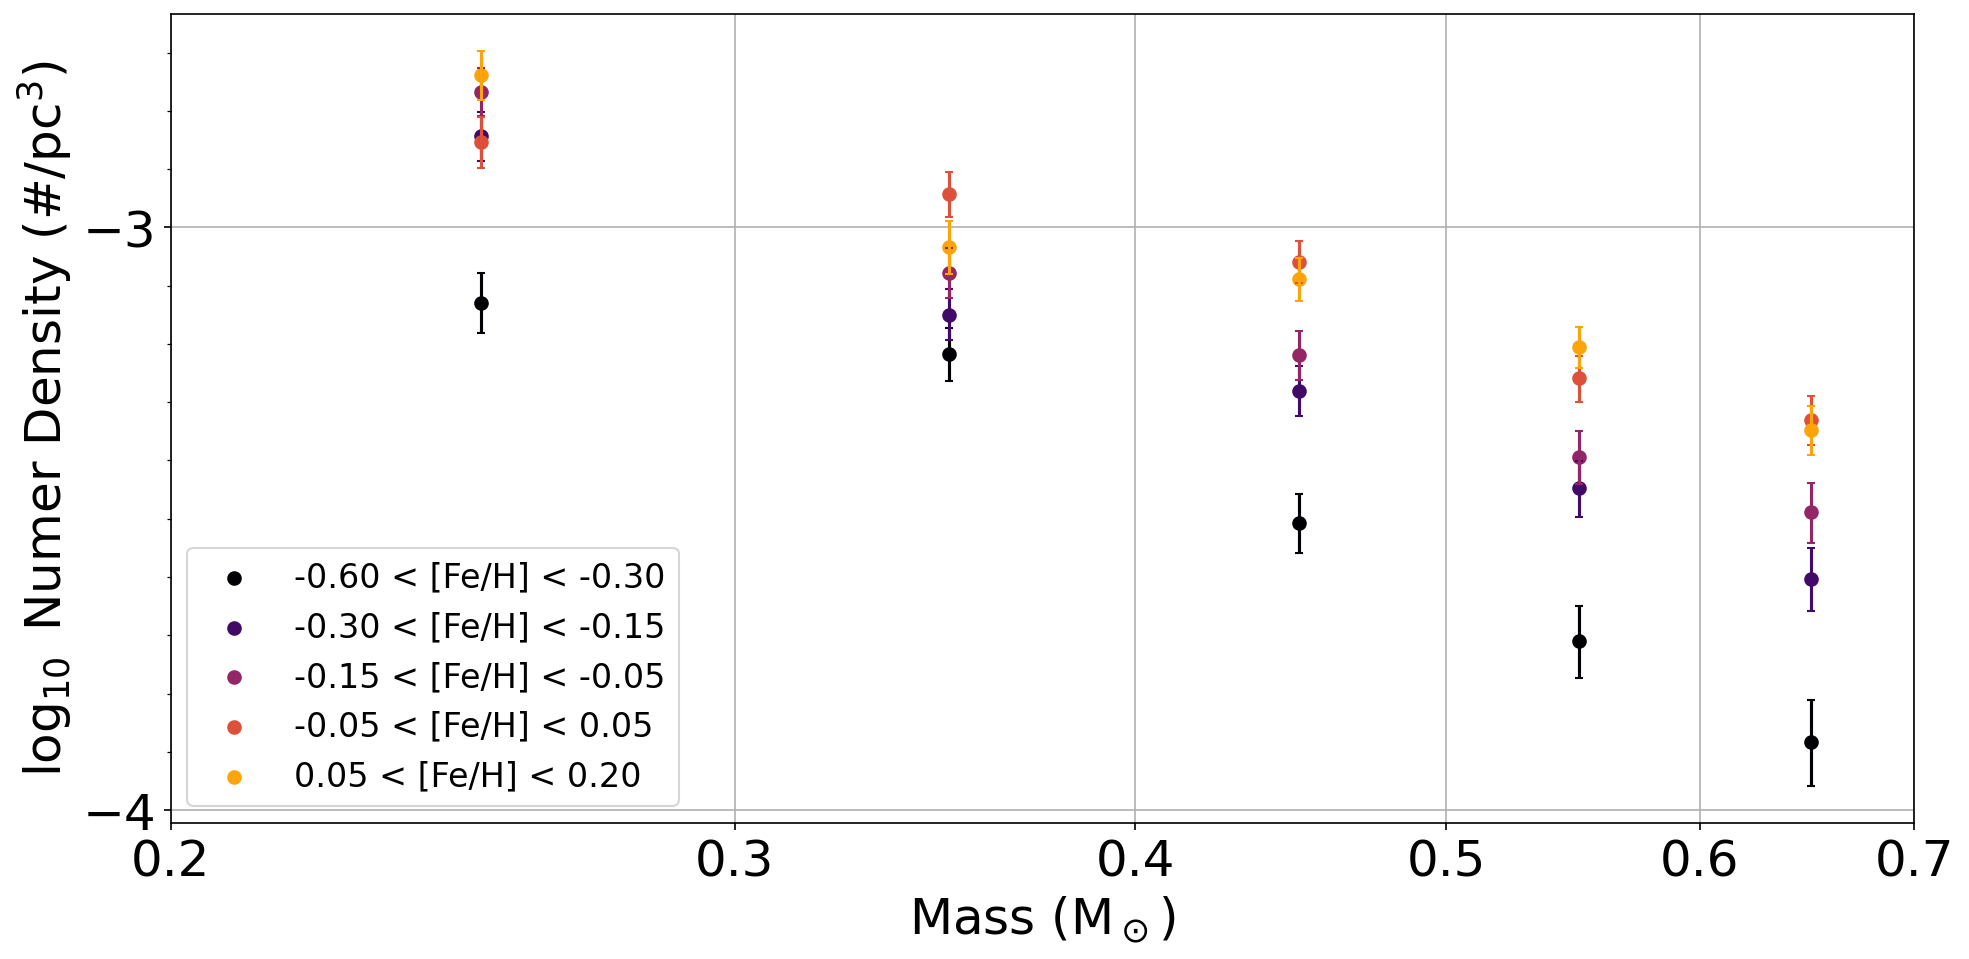
Additionally, the method can be used to probe the true stellar density of stars as a function of metallicity and mass. Here we see a possible change in slope of the
mass function as we decrease in metallicity of the subpopulation. This result serves as an important initial input for an analysis that seeks to determine the true
initial mass function of low-mass stars as a function of metallicity.
This work was recently published in AJ (Medan et al. (2026)) and the code
for this frame work in publicly available on GitHub.
Stellar Parameters from BOSS Spectra
Large spectroscopic surveys require robust pipelines capable of inferring stellar parameters over a wide range of
the Hertzsprung-Russell (HR) diagram from data of varying quality. SDSS-V is one such survey, where the data
from the lower-resolution, optical BOSS spectrograph will provide a large dataset covering a wide range of Galactic
stellar populations. To better analyze these data, we developed BOSS-CLAM, a generative, forward modeling pipeline for
inferring effective temperature, surface gravity, metallicity, and α−abundance.
from continuum-normalized BOSS spectra. BOSS-CLAM maps stellar labels to Non-negative Matrix Factorization (NMF) basis
vector weights via a polynomial mapping jointly optimized with the spectral decomposition, which provides a more flexible
framework for working with the lower-resolution BOSS data. Additionally, training labels are drawn from four complementary
sources (ASPCAP, BOSS-MINESweeper, wide binaries, and a hot star validation sample), which enables coverage from cool
M dwarfs through hot OB stars, and across a wide range of metallicity.
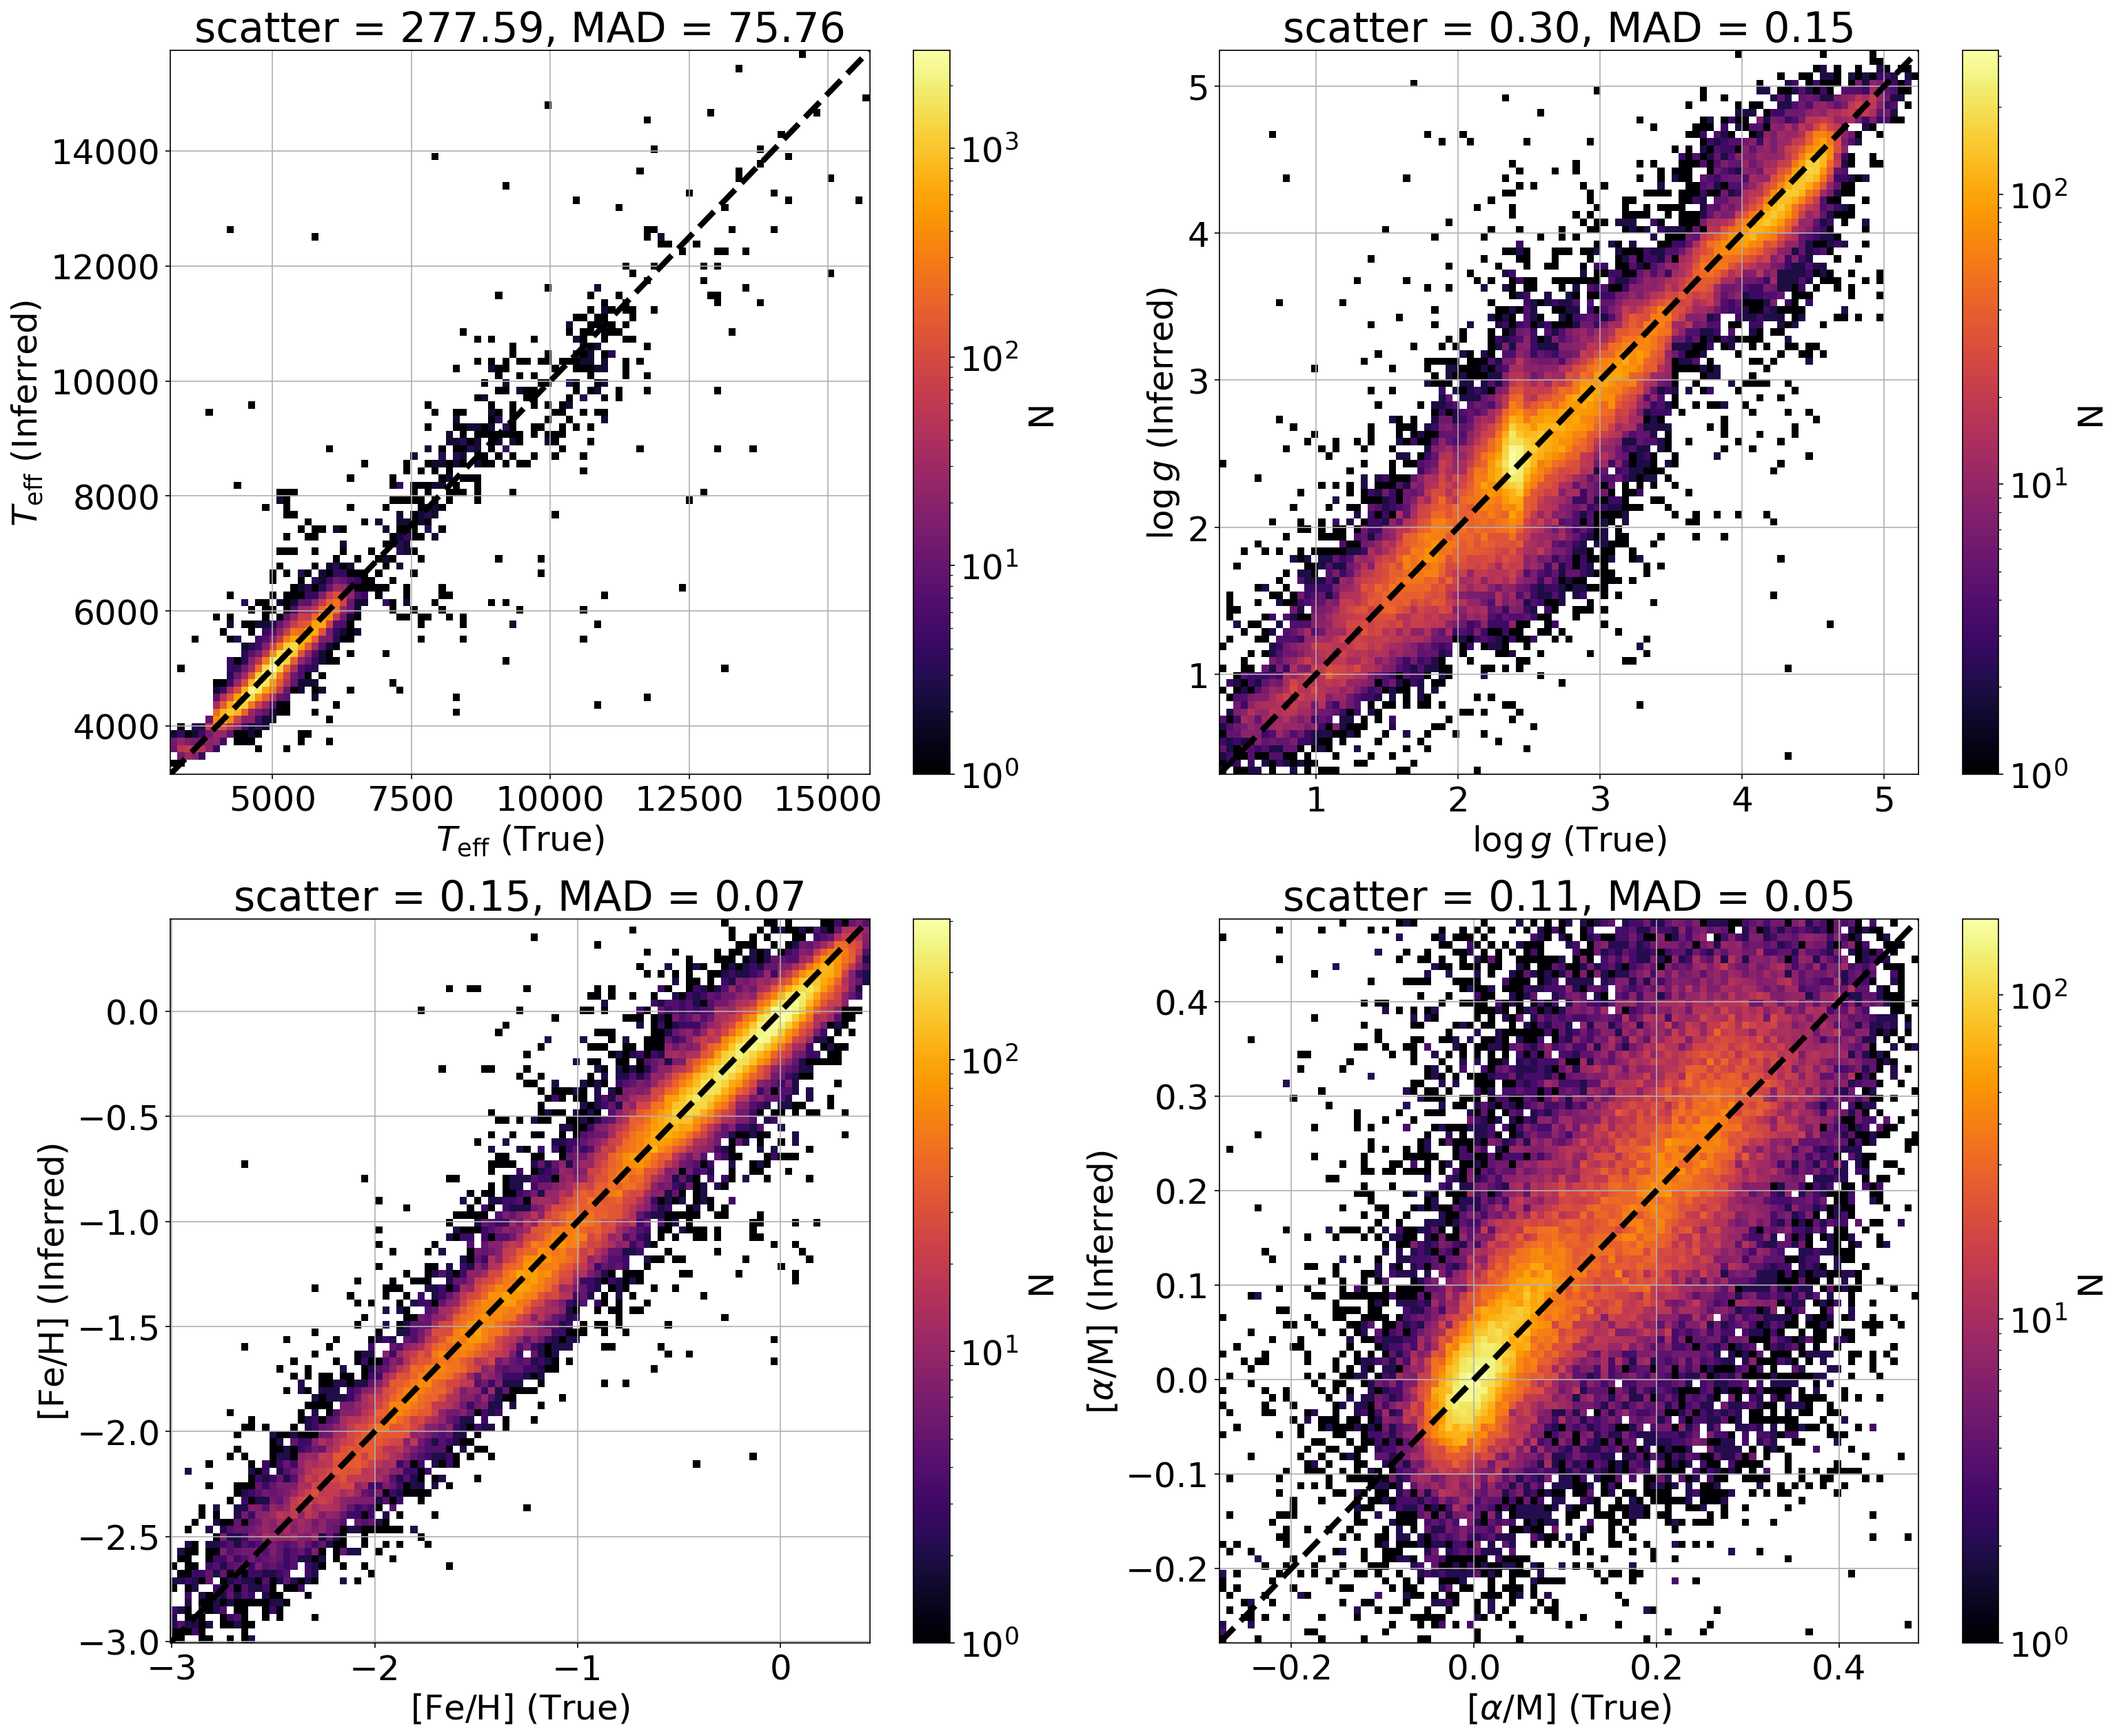
We find that this flexible, generative model is capable of inferring stellar parameters in our testing set with relatively low scatter
and with significantly less systematic biases than other methods. The below plot shows the inferred results from the testing set compared to
their true values. This demonstrates the high accuracy and precision of the method over a wide range of parameter space.
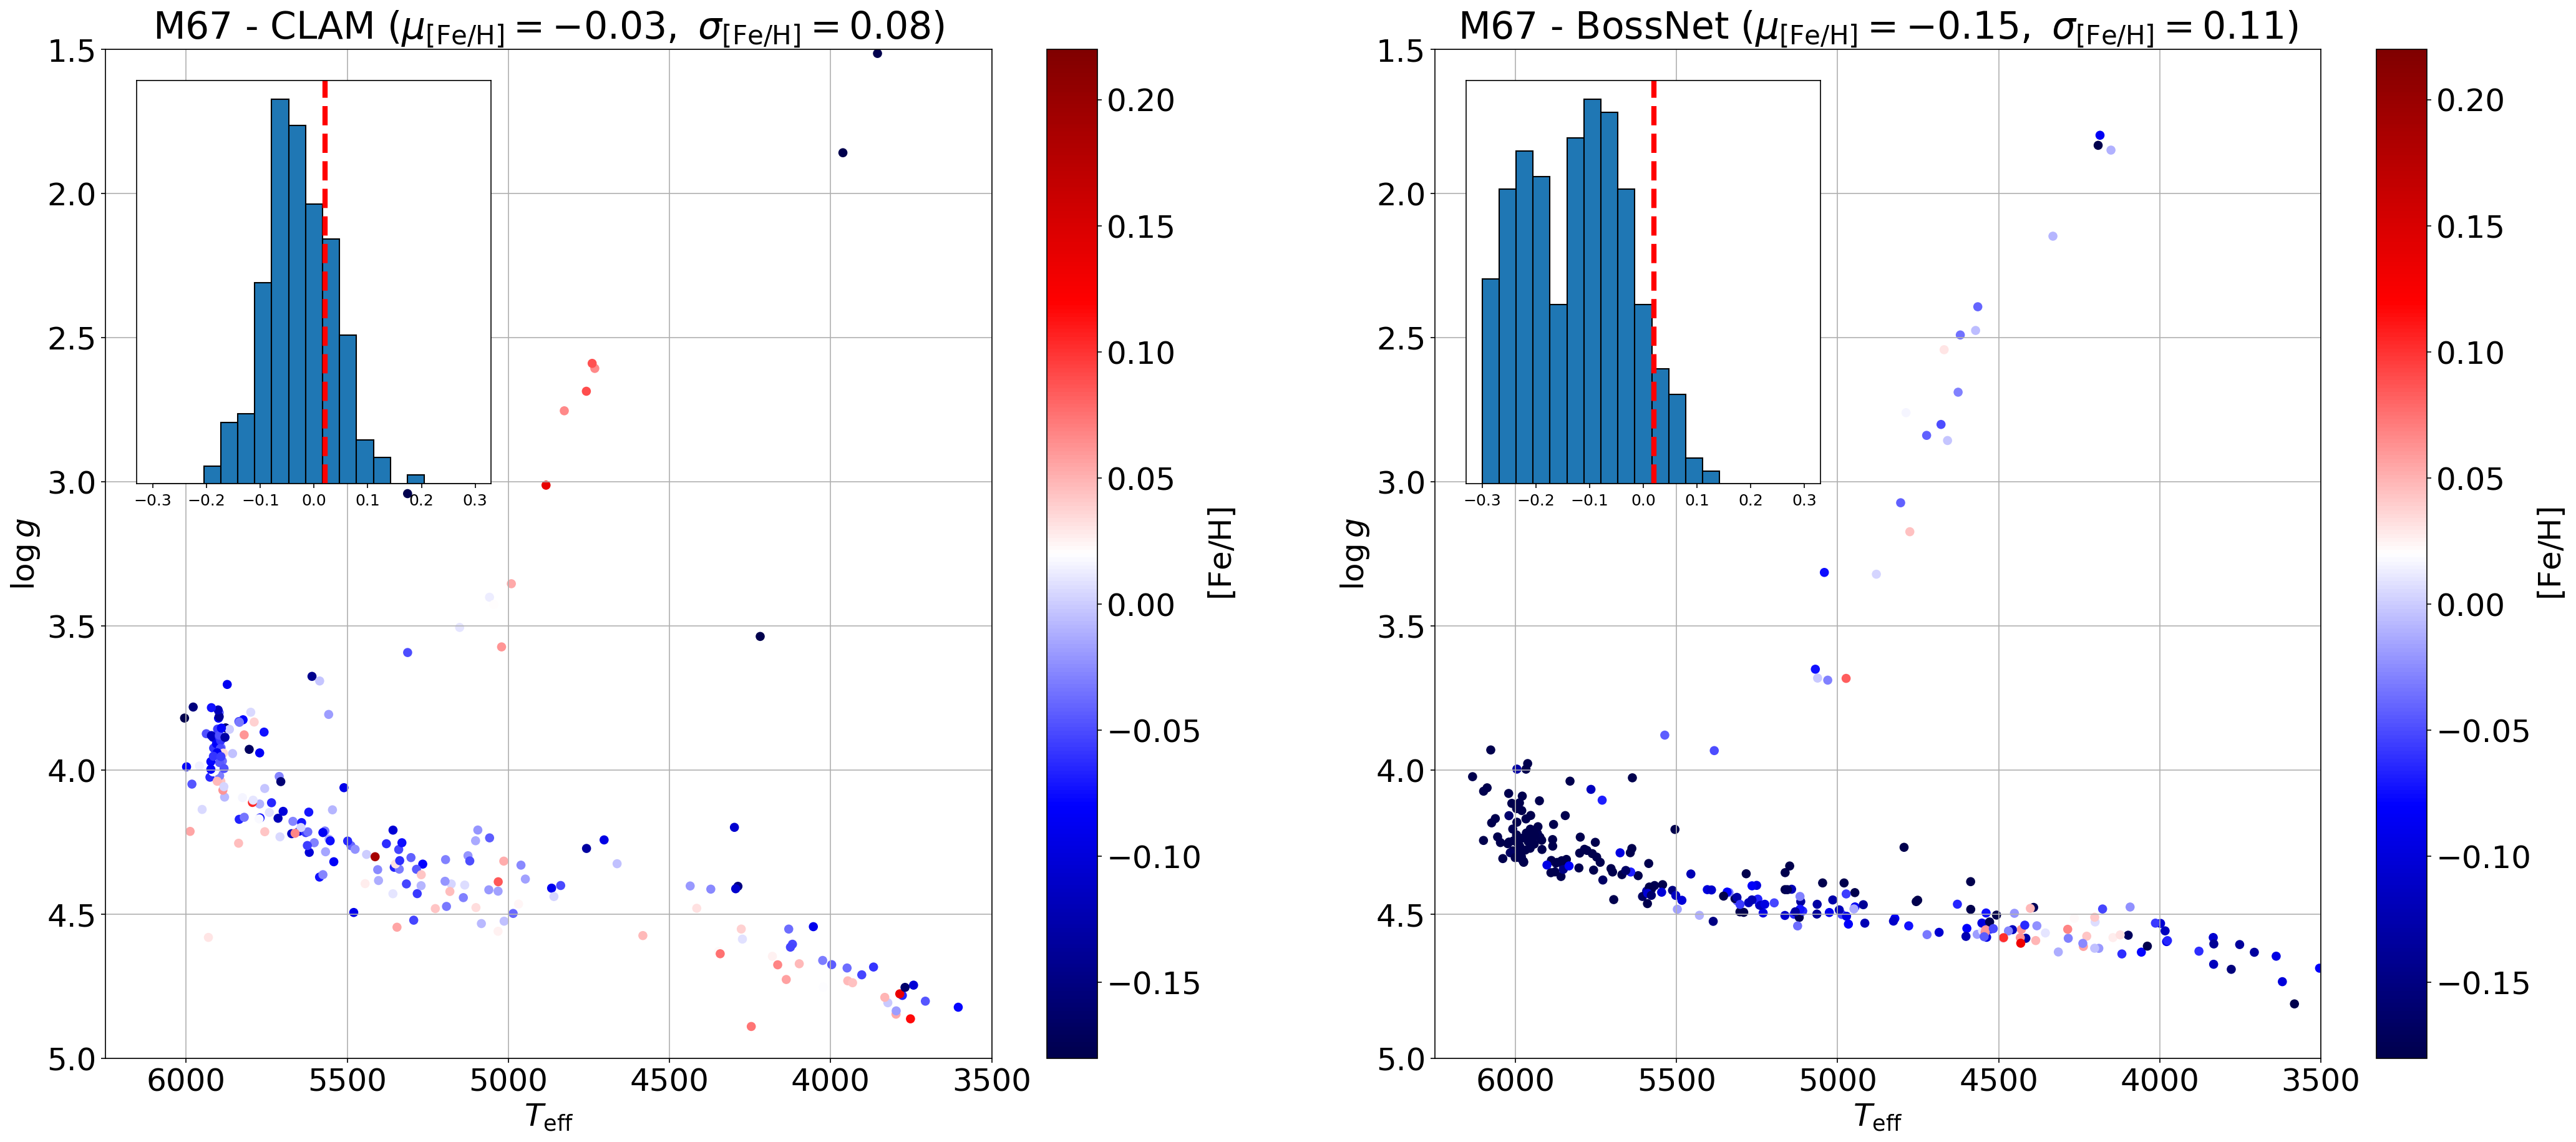
Additionally, the results of the model have been extensively validated on external datasets. One example is with clusters observed in SDSS-V. For example,
the below shows the BOSS-CLAM parameters for M67 (left) as compared to BOSSNet (right). While the scatter is generally larger as compared to BOSSNet, the large systematic errors
in the metallicity from BOSSNet are not present in the BOSS-CLAM results.
The work can be accessed on (arXiv) and the code
for this method in publicly available on GitHub.
Graduate Research
Bayesian Cross-Matching
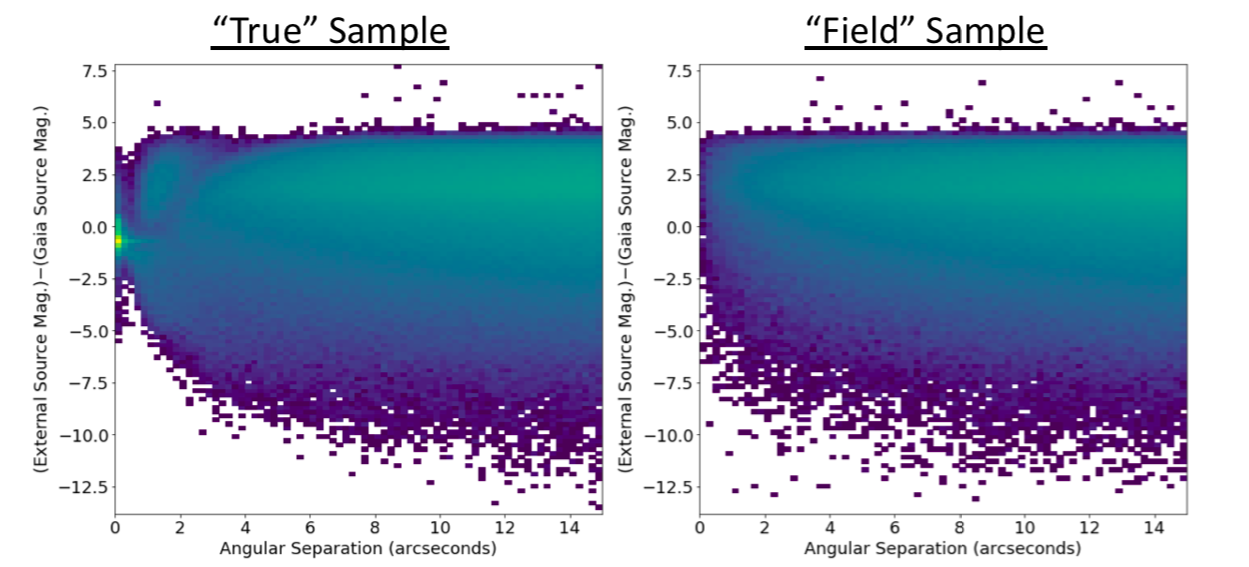
During my first year, I have developed a Bayesian cross-matching method to match high proper motion stars from Gaia DR2 and SUPERBLINK to photometric catalogs spanning the UV to the infrared (such as GALEX, SDSS, Pan-STARRS, RAVE, 2MASS and AllWISE). To associate objects across these catalogs that differ in accuracy and magnitude limit, I compare the multidimensional (astrometry+photometry) distribution of all sources in the vicinity of each high proper motion star ("true" distribution) to a reference distribution of random field stars obtained by extracting all sources in a region on the sky displaced 2’ from the high proper motion star ("field" distribution). The 2’ offset preserves the local field stellar density and magnitude distribution, which allows us to characterize the local frequency of chance alignments, and calculate Bayesian statistics for each match. The two panel below shows such distributions, where the left panel shows the true distribution and the right panel the field distribution. It can be seen that the distribution of random field stars (the field distribution) is a component of the true distribution. Because of this, the subtraction of the field from the true distribution will reveal the distribution of actual matches that can be used to calculate Bayesian probabilities. My resulting high Bayesian probability photometry catalog has been shown to return a higher percent of matches then the internal Gaia DR2 cross-match, especially for Pan-STARRS where I have a match rate of ~98% within the footprint of the survey as compared to ~21% for the internal Gaia match. I have presented this work at the 235th AAS meeting, where more details can be found (poster and abstract). Also, this work has been accepted for publication in The Astronomical Journal.
If you would like use my cross-matching method for your research, I have made the code to carry out a macth for stars in Gaia DR2 to another photometric catalog available on my GitHub.
Photometric Metallicity Calibrations
Using the results from my Bayesian Cross-Match, I am interested in utilizing photometry to estimate stellar metallicites of low-mass stars. Using derived metallicities from APOGEE as the basis of a calibration subset, I trained a Gaussian Process Regressor (with multiple colors and absolute magnitudes from Pan-STARRS, 2MASS and AllWISE as inputs) to predict metallicities for K and early M dwarfs with a precision of 0.12 dex. This calibrated relationship is largely free of systematic errors, that were present in past regressors. I have presented this work as a poster for the Royal Astronomical Society Early Career Poster Exhibition and at the 237th AAS meeting. Also, this work has been accepted for publication in The Astronomical Journal.
If you would like to estimate photometric metallicities of stars in a sample for your own research, I have made this Gaussian Process Regressor available on my GitHub.
Chemodynamical Ages of Small-Scale Kinematic Structures
By combining data from Gaia DR3 and the above photometric metallicties, I am able to examine the chemodynamic structures in the vicinity of the Sun (d < 300 pc) in great detail. These chemodynamics are shown in the left panel in the plot below. Here we see a plot of guiding radius vs. U velocity that is color-coded by the median velocity of the stars in the phase space. Overlayed are ellipses that show the location of local kinematic groups, which are identified as over-densities in the kinematic plane. In this plane, we see clear chemical enhancements that are correlated with some of the kinematic groups. If we also look at the dispersion in the W velocity across this kinematic plan (right panel), we also see much lower dispersions inside some of these kinematic groups. As it has been shown that velocity dispersion is correlated with age, I hypothesized these differences are related to changes in the underlying age distribution across the kinematic plane.
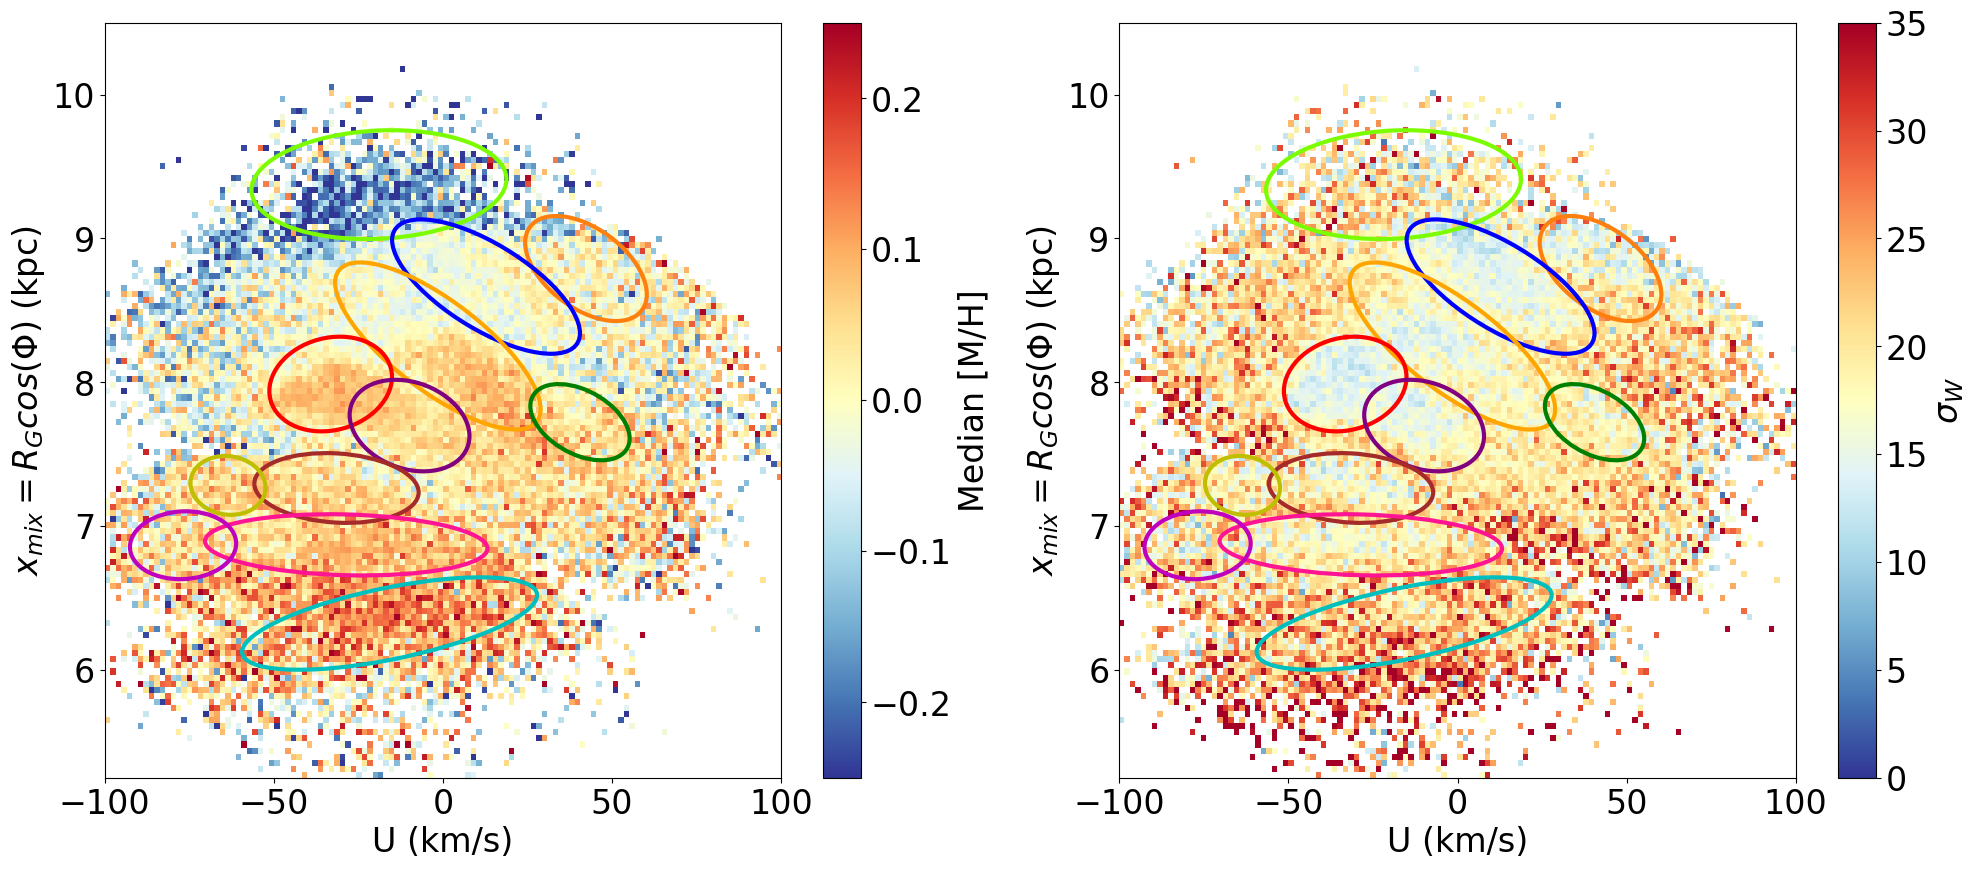
To test this, I developed a method to estimate the age distribution of subpopulations of stars. In this method, I use GALAH data to define probability distributions of W versus [M/H] in age bins of 2 Gyr and determine optimal age distributions as the best-fitting weighted sum of these distributions. This process is then validated using the GALAH subset. I then estimated the probable age distribution for regions in the kinematic plane, where I found significant substructure that is correlated with the kinematic groups. Most notably, I found an age gradient across the Hercules streams that is correlated with birth radius. This work is published in MNRAS, and the age and birth radii distributions, along with the code to reproduce them, can be found here.
Pre-Graduate Research
After receiving my B.S. in Mechanical Engineering, with a minor in Physics, from Santa Clara University, I worked at the SOFIA Science Center as a research assistant for first Dr. Ravi Sankrit and then Dr. B-G Andersson. With Dr. Sankrit I used HST images of Kepler's Supernova Remnant in order to catalog and study the evolution of the bright, radiative knots, and the stellar properties (color and proper motion) of the stars in the field (230th AAS poster and abstract).
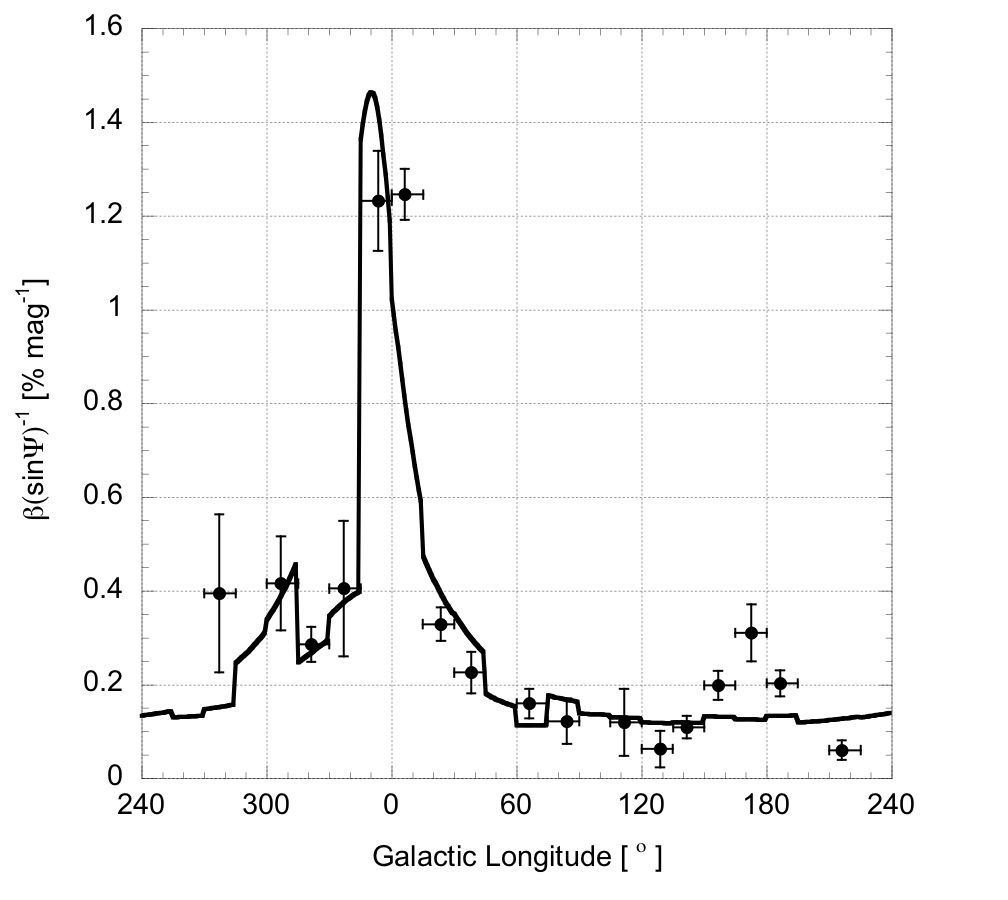
With Dr. Andersson I studied the variations in grain alignment in the wall of the Local Bubble using archival polarimetry, photometry and spectroscopy (231st AAS poster and abstract). The plot above shows a proxy for grain alignment efficiency vs. galactic longitude for the observed grain alignment efficiency in the wall of the Local Bubble (data points). The solid line shown in the plot is the strength of the radiation field from the nearby OB associations at the distance of the Local Bubble wall. As it can be seen, there is a strong correlation between the observed grain alignment efficiency and the nearby radiation field, which supports radiatively driven grain alignment. Additionally with Dr. Andersson, I preformed radiaitve transfer modeling of the circumstellar envelope of the carbon-rich AGB star IRC +10216.